Achartengine is a great graphing library for android. It makes making those beautiful looking pie charts and bar charts a relatively simple task. Much better than trying to draw them yourself.
You can download achartengine jar file here – http://achartengine.org/content/download.html
How to set it up?
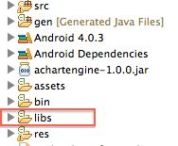
After downloading the jar file, copy it to your libs folder within the project. Make a libs folder if none exists for your project.
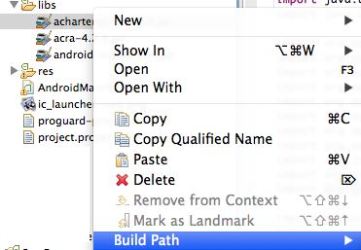
After copying the jar file to your libs folder, right click and add the file to build path.
Now we are all setup to use achartengine classes and methods. I will show you how to make a pie chart by retrieving values from sqlite database table.
Database setup –
I have an expense table which has the following 3 columns –
_id
expense_amount
expense_category
Activity Setup – We will call our activity ChartsActivity. Make a file named ChartsActivity.java within your src folder (or a subfolder within that) which will extend Activity class. Again, this can be done with fragments or fragment activity too. We will next create an xml file for the activity UI. For that lets create a file named charts.xml in our res folder. My charts.xml looks like this –
<RelativeLayout xmlns:android="http://schemas.android.com/apk/res/android" android:id="@+id/chartsRelativeLayout" android:layout_width="fill_parent" android:layout_height="fill_parent">
</RelativeLayout>
You can have LinearLayout or any other layout in place of RelativeLayout. I have given it an id so that we can later catch hold of the layout and add our graphical view to it.
Now in our Activity, we have to do the following steps –
Step 1 – Set up the graph variables and UI. We will define some global variables to store the Graphical View and Renderers –
GraphicalView mChartView = null;
private DefaultRenderer mRenderer = new DefaultRenderer();
private CategorySeries mSeries = new CategorySeries("Expenses");
private static int[] COLORS = new int[] {
    Color.GREEN, Color.BLUE, Color.MAGENTA, Color.YELLOW, Color.RED, Color.DKGRAY, Color.BLACK};
The COLORS array will be used to define color for each section of the pie chart. The CategorySeries object holds the value for each section of the pie. So for each section of the pie we will have one CategorySeries. And we will add all those CategorySeries objects to the DefaultRenderer to render the final pie chart and return a graphical view – mChartView in our case.
Step 2 – Query the database to get category wise total expenses. We can do it with the following sql query –
Select expense_category, sum(expense_amount) from expenses group by expense_category
I will assume here that you have a data provider set up or some custom database helper which will return you a cursor for the above query. We will store the result of the query in a Cursor object named cursor.
Step 3 – Link the values returned from the database to our pie chart objects.
Cursor cursor = getContentResolver().query(uri, EXPENSE_PROJECTION, where, null, null);
int count = cursor.getCount();
double[] values = newdouble[count];
String[] categoryNames = new String[count];
for(int i = 0; i < count; i++) {
    cursor.moveToNext();
    values[i] = cursor.getDouble(1);
    categoryNames[i] = cursor.getString(0);
}
int i = 0;
mSeries.add(categoryNames[i], value);
SimpleSeriesRenderer renderer = new SimpleSeriesRenderer();
renderer.setColor(COLORS[(mSeries.getItemCount() - 1) % COLORS.length]);
renderer.setDisplayChartValues(true);
mRenderer.addSeriesRenderer(renderer);
i++;
mChartView = ChartFactory.getPieChartView(this, mSeries, mRenderer);
Step 4 – This is the final step where we will add the Graphical View to our layout, i.e. the one we defined in the xml file.
RelativeLayout.LayoutParams params = new RelativeLayout.LayoutParams(RelativeLayout.LayoutParams.MATCH_PARENT,RelativeLayout.LayoutParams.WRAP_CONTENT);
mChartView.setLayoutParams(params);
RelativeLayout layout = (RelativeLayout) findViewById(R.id.chartsRelativeLayout);
layout.addView(mChartView);
And that is it. I added a spinner to add a time filter to my chart. Here is how it looks –
Do let me know if you have any questions.


Zeitdata
/ March 10, 2013Have you checked out Zeitdata Charts? http://charts.zeitdata.com. It currently supports a few different Line chart variants, but will get more in the future. Its really light, at less than 100 kb, and focusses on aesthetically pleasing output with minimal work required.
mahalakshmi
/ July 31, 2013can u take input frm a normal string array instaed from database and show the pie chart
mukeshsoni
/ July 31, 2013Yes it can. Even after taking from the database, it has to be converted to a datastructure understood by the charing api.